
Part 2.3 Mapping your results
Part 2.3 of the PEP Capabilities Framework shows you how to create a spider diagram using your results from part 2.2.
Introduction
The spider diagram provides a visual representation of your current capabilities and where you would like to develop in the future. Comparing your current and aspirational levels can help you identify development priorities and areas for further reflection.
Using example data, we have created the below spider diagram.
Example maturity data and spider diagram
| Capability Area | Current maturity level | Aspirational maturity level |
|---|---|---|
| Engagement design, facilitation and co-creation | 1 | 4 |
| Ethics, inclusion, duty of care and quality | 4 | 4 |
| Partnership, community and relationship management | 1 | 3 |
| Evidence, evaluation, learning & knowledge sharing | 2 | 4 |
| Strategic insight, governance and culture change | 3 | 3 |
| Operational delivery, communications & service design | 1 | 3 |
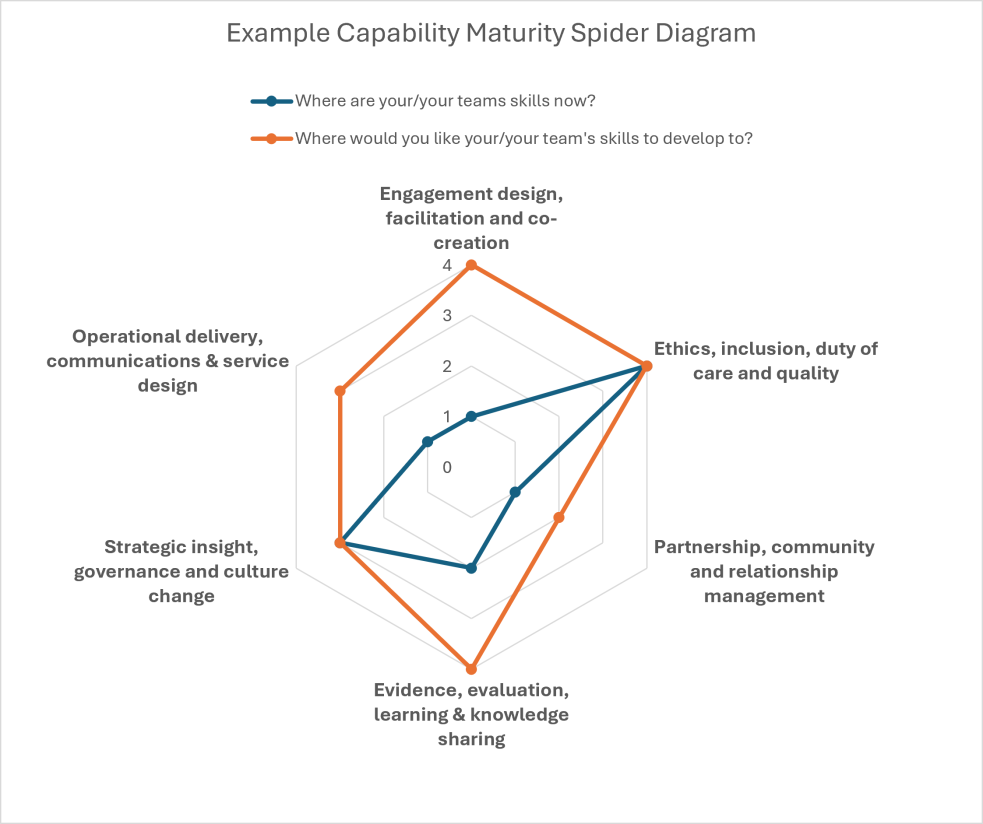
How to interpret the diagram
- Identify your strengths. Areas where your current score is high indicate established capabilities that you can build on and potentially share with others.
- Look for gaps between the lines. The larger the gap, the greater the opportunity for development in that capability area.
- Prioritise carefully. Not every gap needs immediate action. Focus on the capabilities that are most important for your role, goals or team priorities.
- Use the results to inform your development planning. The spider diagram is intended to help you identify where to focus your learning, experience and professional development efforts.
Create your own spider diagram
Before you start: this Spider diagram will require you to have installed Microsoft Word and Excel (or other compatible software)
Download and save the spider diagram excel document (link below) to your computer. Once the google doc opens, select: file – download – Microsoft Excel. Please note, the diagram may not work on googledocs.
Complete the self-assessment exercise in part 2.2 and assign a current maturity level for each key area/skill. You may use the workbook to guide you through this.
Assign an aspirational level. For each of the key areas, decide where on the scale you would like them to develop to in the future – your aspirational level. Please note - you may be content with your current position, in this case both maturity levels will be the same.
- For each of your current and aspirational levels, assign a numerical value:
- Foundation: 1
- Practitioner: 2
- Lead: 3
Strategic: 4
In the excel spreadsheet, input your maturity and aspirational numbers into the relevant fields.
The diagram should automatically update in the excel spreadsheet.
Once completed, feel free to copy and past the diagram onto the worksheet / into your notes.
Areas where the orange and blue lines diverge are sections where there is a gap between your aspiration and your current activity. These areas are worth exploring further using the online resources.
- Save the Excel document with a new file name. You may wish to re-do the exercise at a later point to review your progress.